Work / Live demos
Lumen Analytics
Revenue and behavior analytics for a B2B SaaS, with anomaly detection at the center instead of bolted on the side. Lumen is a demonstration product; every figure is synthetic, the detector, the attribution, and the UI on top of them are real and running. Open the live demo and use the one-click sign-in on the landing. The whole thing is also exposed as an MCP server, so you can point Claude Desktop or any other MCP client at it and query the metrics and anomaly attribution yourself. See how to connect.
The problem domain
Most SaaS analytics products are very good at showing you a chart and very bad at telling you when the chart is doing something it should not be doing. The day MRR drifts off trend, the company finds out about it from a Monday morning email thread, not from the product that already had the data in front of it. Detection inside the product is the underbuilt half: it requires a model, a calibration story, per-slice attribution, and a workflow that someone on the revenue team can actually run through on a Tuesday afternoon.
What we built
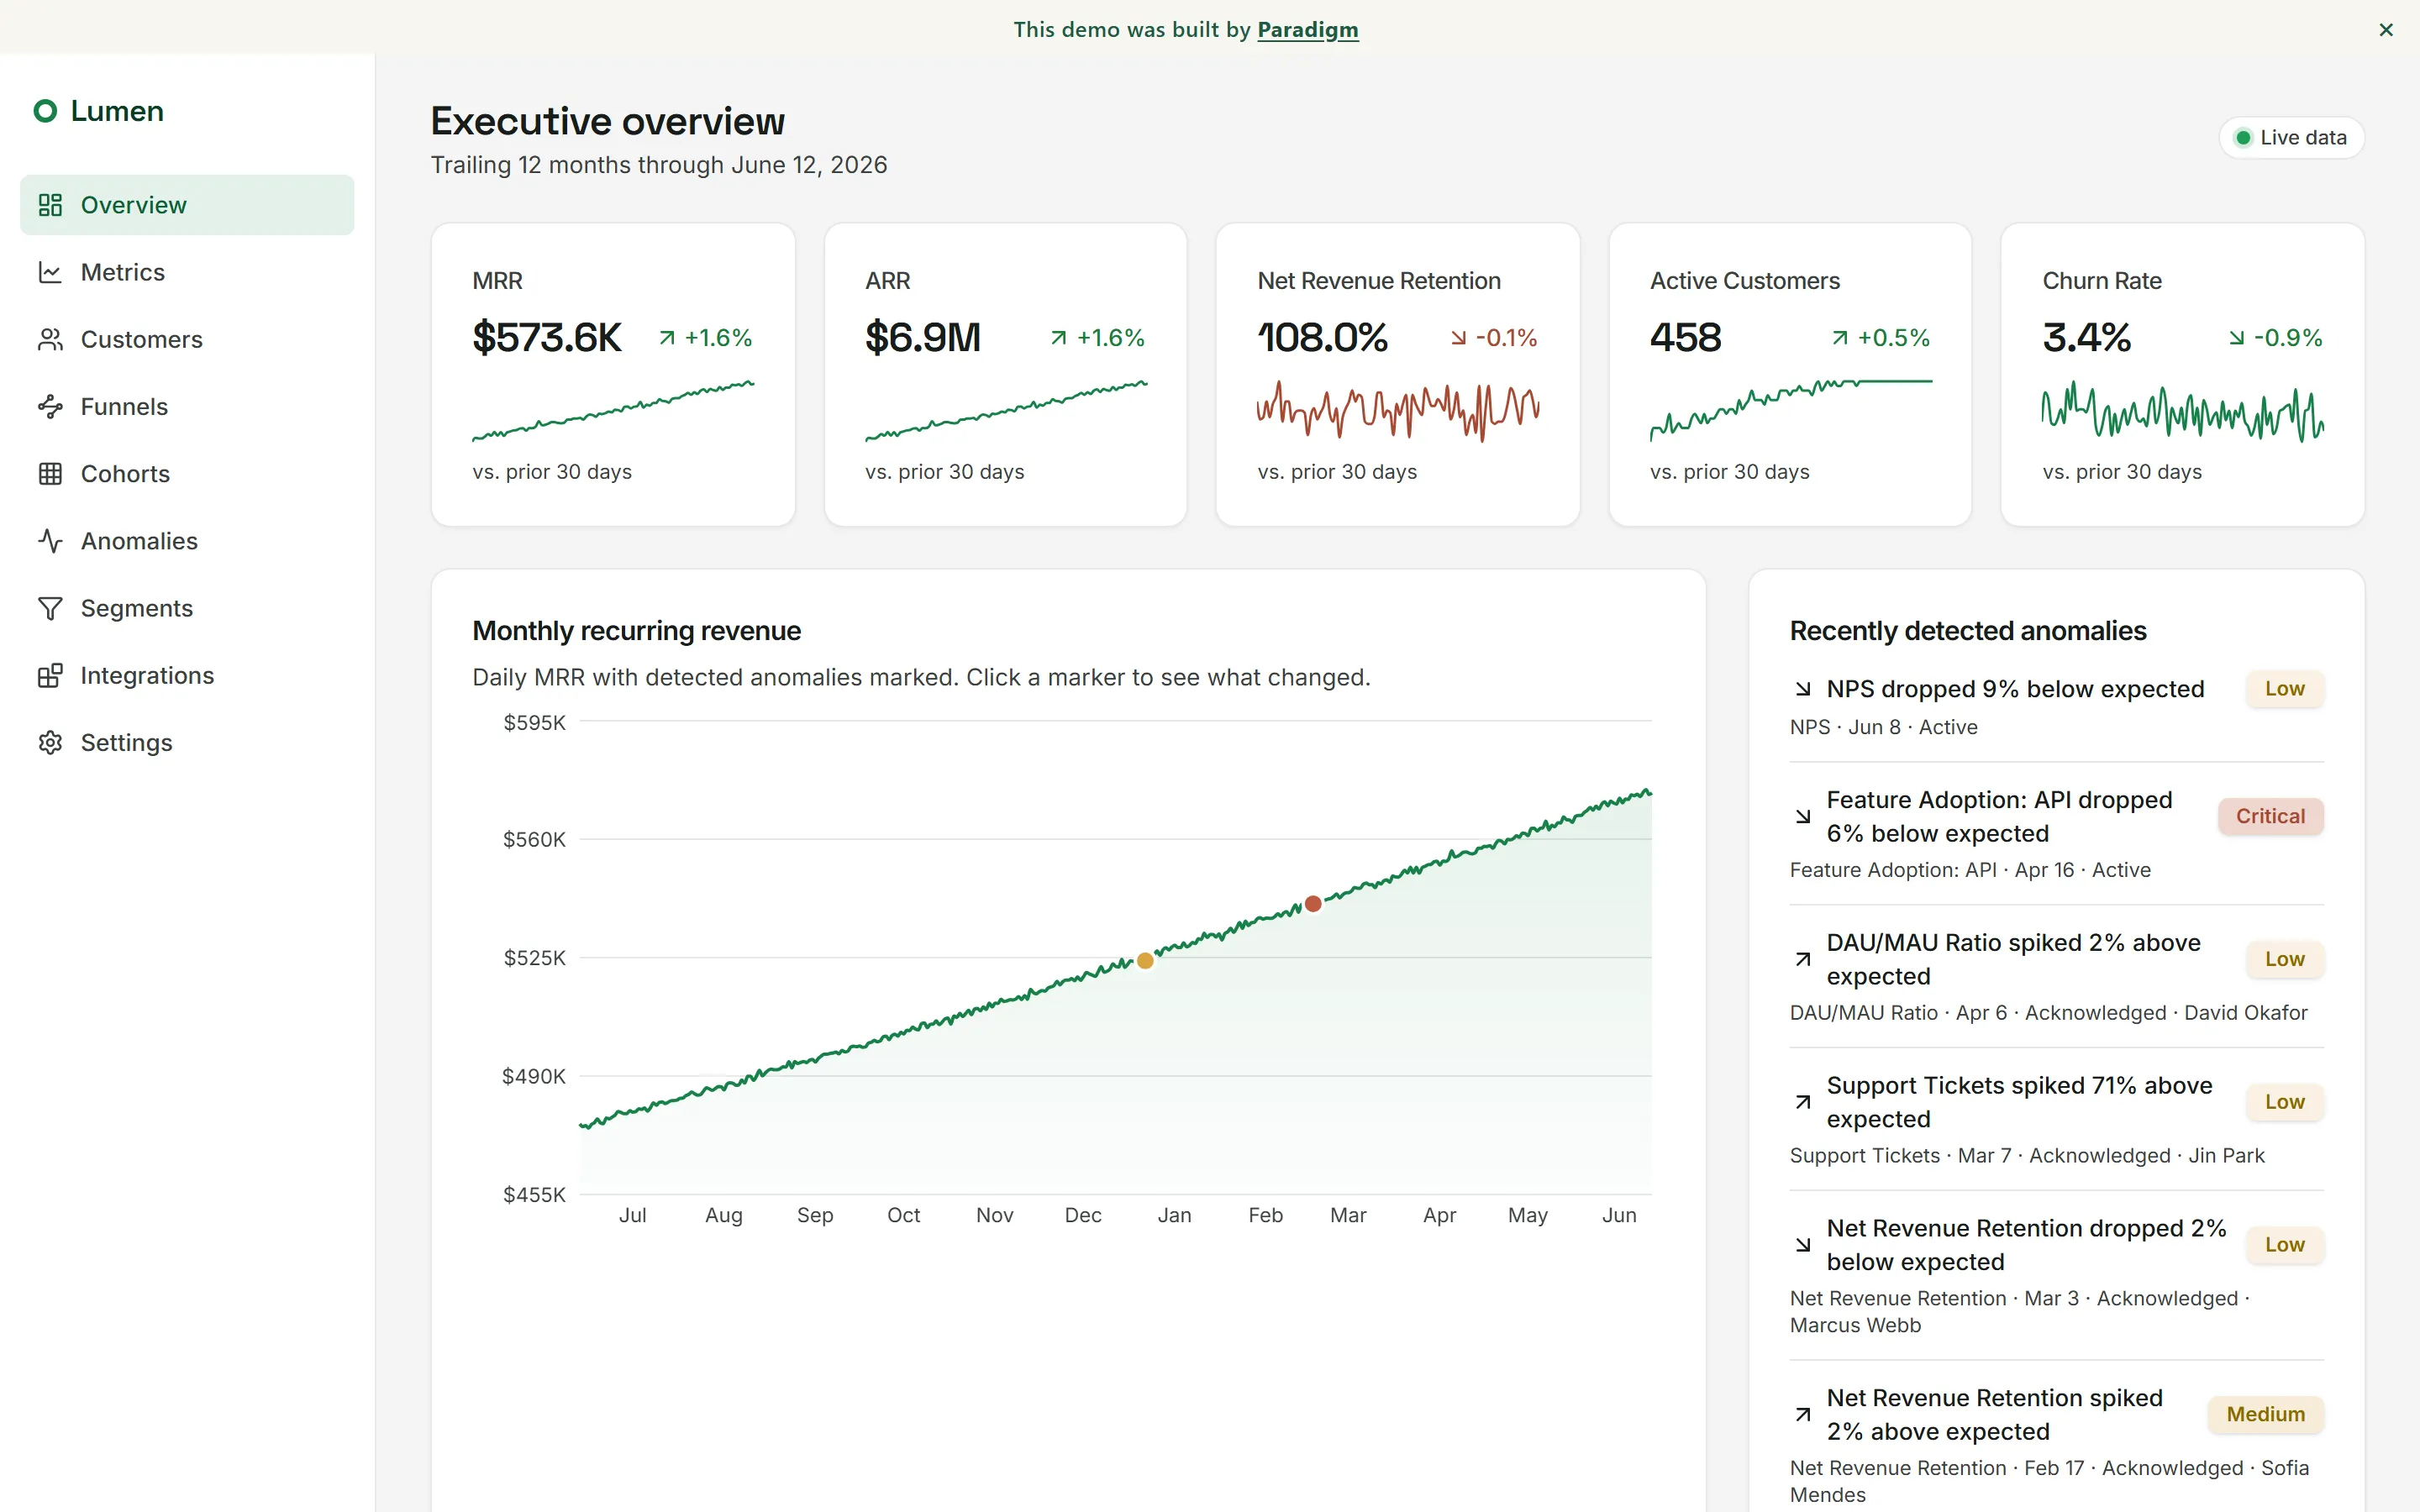
A complete revenue and behavior analytics surface over a synthetic 500-customer SaaS: a 32-metric catalog (revenue, retention, acquisition, product engagement, support) covering 365 days, 14 of them sliced at the segment-cell level by plan tier, geography, and industry. An executive overview with KPI cards and an MRR trend chart, a metrics explorer with sparklines and segment-slice toggles, a 500-row customer list with account detail, a d3-sankey acquisition funnel with drop-off sinks, a signup-cohort retention heatmap (NRR and logo retention), segments with live counts, and a marketing landing. Next.js 14, TypeScript, SQLite, Tailwind v4, behind a one-click demo cookie that gates the app surface; the landing is public.
The data is deterministic by design. A fixed seed plus the run-day end date plus segment-cell aggregation means every KPI on every page reconciles to the customer list, and three scripted anomalies (Starter and EMEA churn, Enterprise and NA expansion, Growth and Software API drop) sit in real segment cells where attribution can find them.
The anomaly story
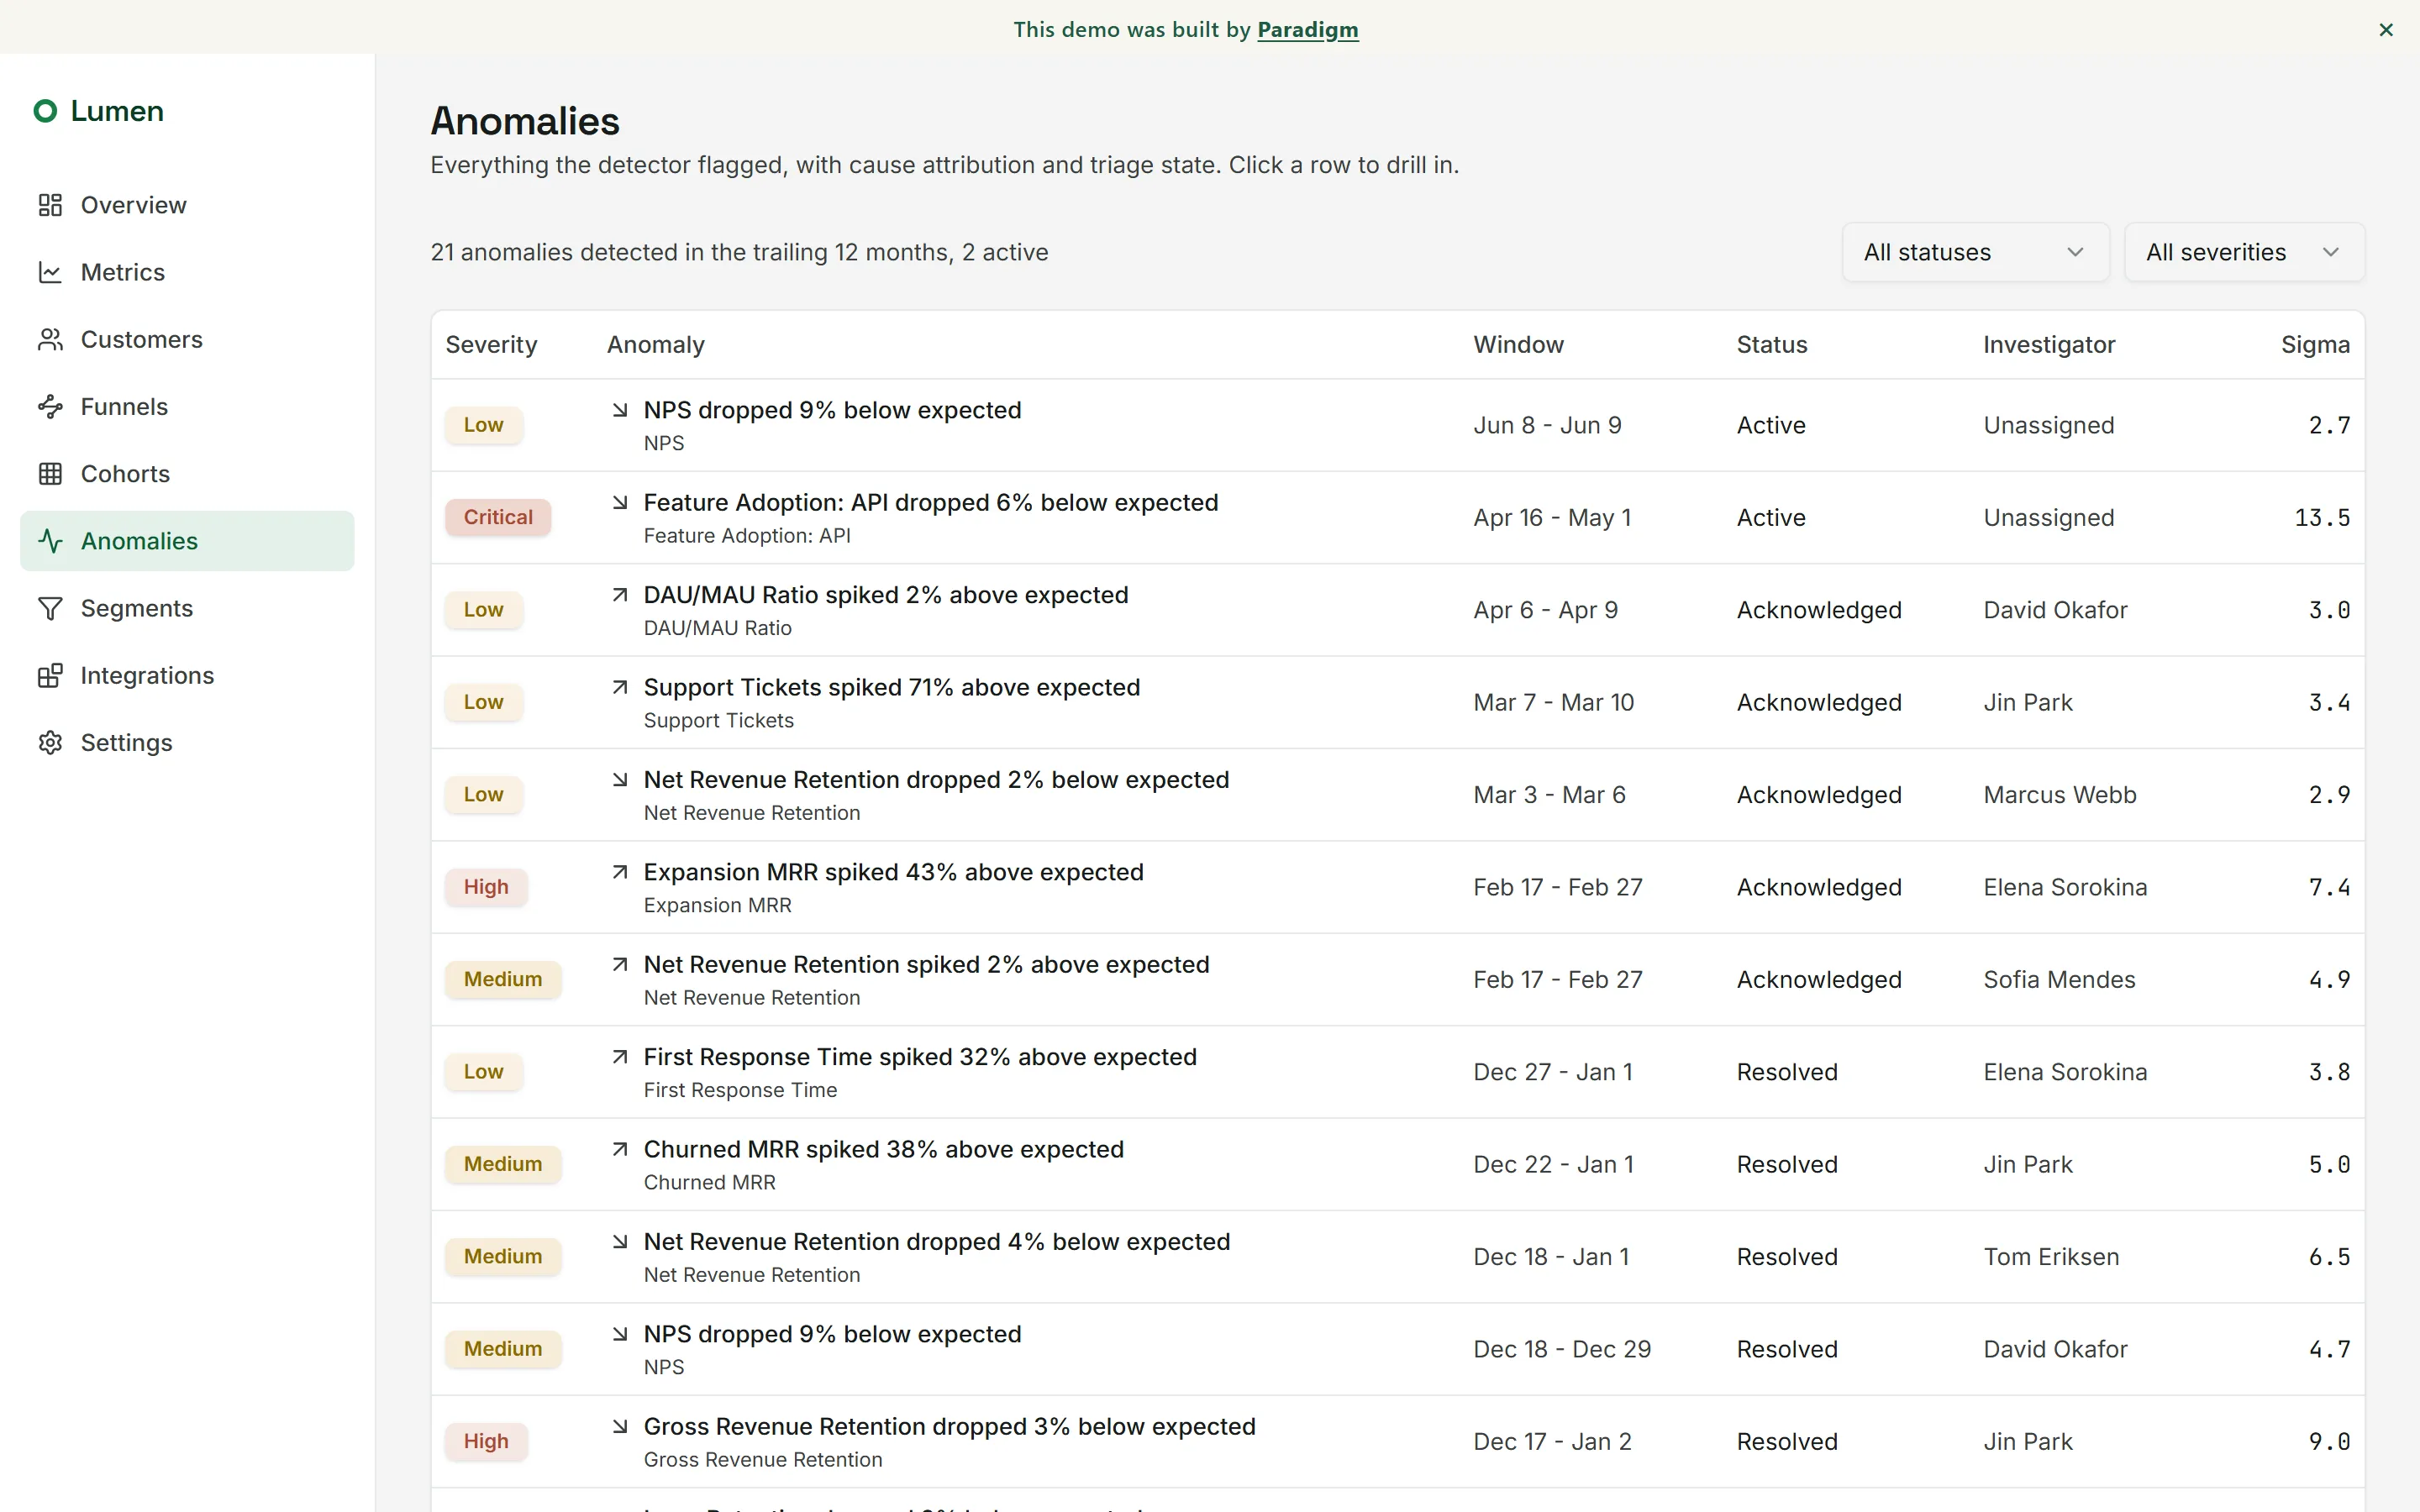
The detector is a rolling-median STL-style decomposition: per-metric, per-day, decompose the series into trend and seasonality, score the residual with a median absolute deviation sigma, group consecutive flagged points into episodes with a magnitude floor and edge guard. Twenty-seven episodes on the synthetic dataset, and the three scripted anomalies always land in the right severity band, with the right window, in the right slice.
Detection by itself is half the product. Every episode comes with cause attribution: per-slice z-ranking, contribution shares, and a generated narrative the user reads before drilling in. The drill-down panel shows an expected-versus- actual chart with the shaded episode window, the top three contributing slices with their own mini charts and contribution percentages, suggested next steps, and the triage actions (Acknowledge, Assign, mark False positive) that persist. The /app/anomalies log is the queue; ?focus deep links into the panel from any feed or markers.
Forty-six tests pin all of this -- the windows, the slices, the severities, the status transitions, the segment-cell aggregation -- so a change to the generator or detector that would silently move a scripted anomaly cannot ship.
The production path
A real deployment swaps the synthetic generator for the operator's warehouse, the SQLite snapshot for an incremental extract that respects the company's data freshness contract, and the one-click demo cookie for whatever identity layer the team already runs. The detector's interface, the attribution method, the triage workflow, and the UI underneath them do not change. The point of building the detection backend and the triage UX first is exactly that: the production swap is data plumbing, not a product rewrite.
Connect over MCP
Lumen ships an MCP (Model Context Protocol) server, so a model can query the demo directly instead of reading a dashboard. It exposes three read-only tools: search the 32-metric catalog, list the recently detected anomalies, and pull the per-slice cause attribution for any one of them. The same detection and attribution described above, this time addressable by an agent.
Point Claude Desktop (or Cursor, or the MCP Inspector) at the built server. In claude_desktop_config.json:
{
  "mcpServers": {
    "lumen-analytics": {
      "command": "node",
      "args": ["/absolute/path/to/lumen-analytics/mcp/dist/mcp/server.js"]
    }
  }
}
The server lives in the Lumen repository under mcp/. Build it from the repo root (npm install, npm run seed:full, then npm run mcp:build), restart the client, and the three lumen_ tools appear in the tool menu. It is read-only by design: an agent can look, never touch.
Want this shape of analytics over your own revenue and behavior data? Tell us what you're trying to do.