Work / Live demos
AxlePoint Industrial
Asset health and maintenance operations for heavy industry. AxlePoint is a demonstration product; the data is synthetic, the software is real and running. Open the live demo and sign in as the demo user; no account needed.
The problem domain
Heavy industry runs on rotating equipment: engines, generators, compressors, pumps. When one fails unplanned, the cost is measured in lost production hours and emergency parts orders with multi-week lead times. The operational questions are always the same. Which machines are trending toward failure? What evidence says so? Who fixes it, with what parts, and when? Most maintenance software answers the last question only. The first two stay in a spreadsheet, or in someone's head.
What we built
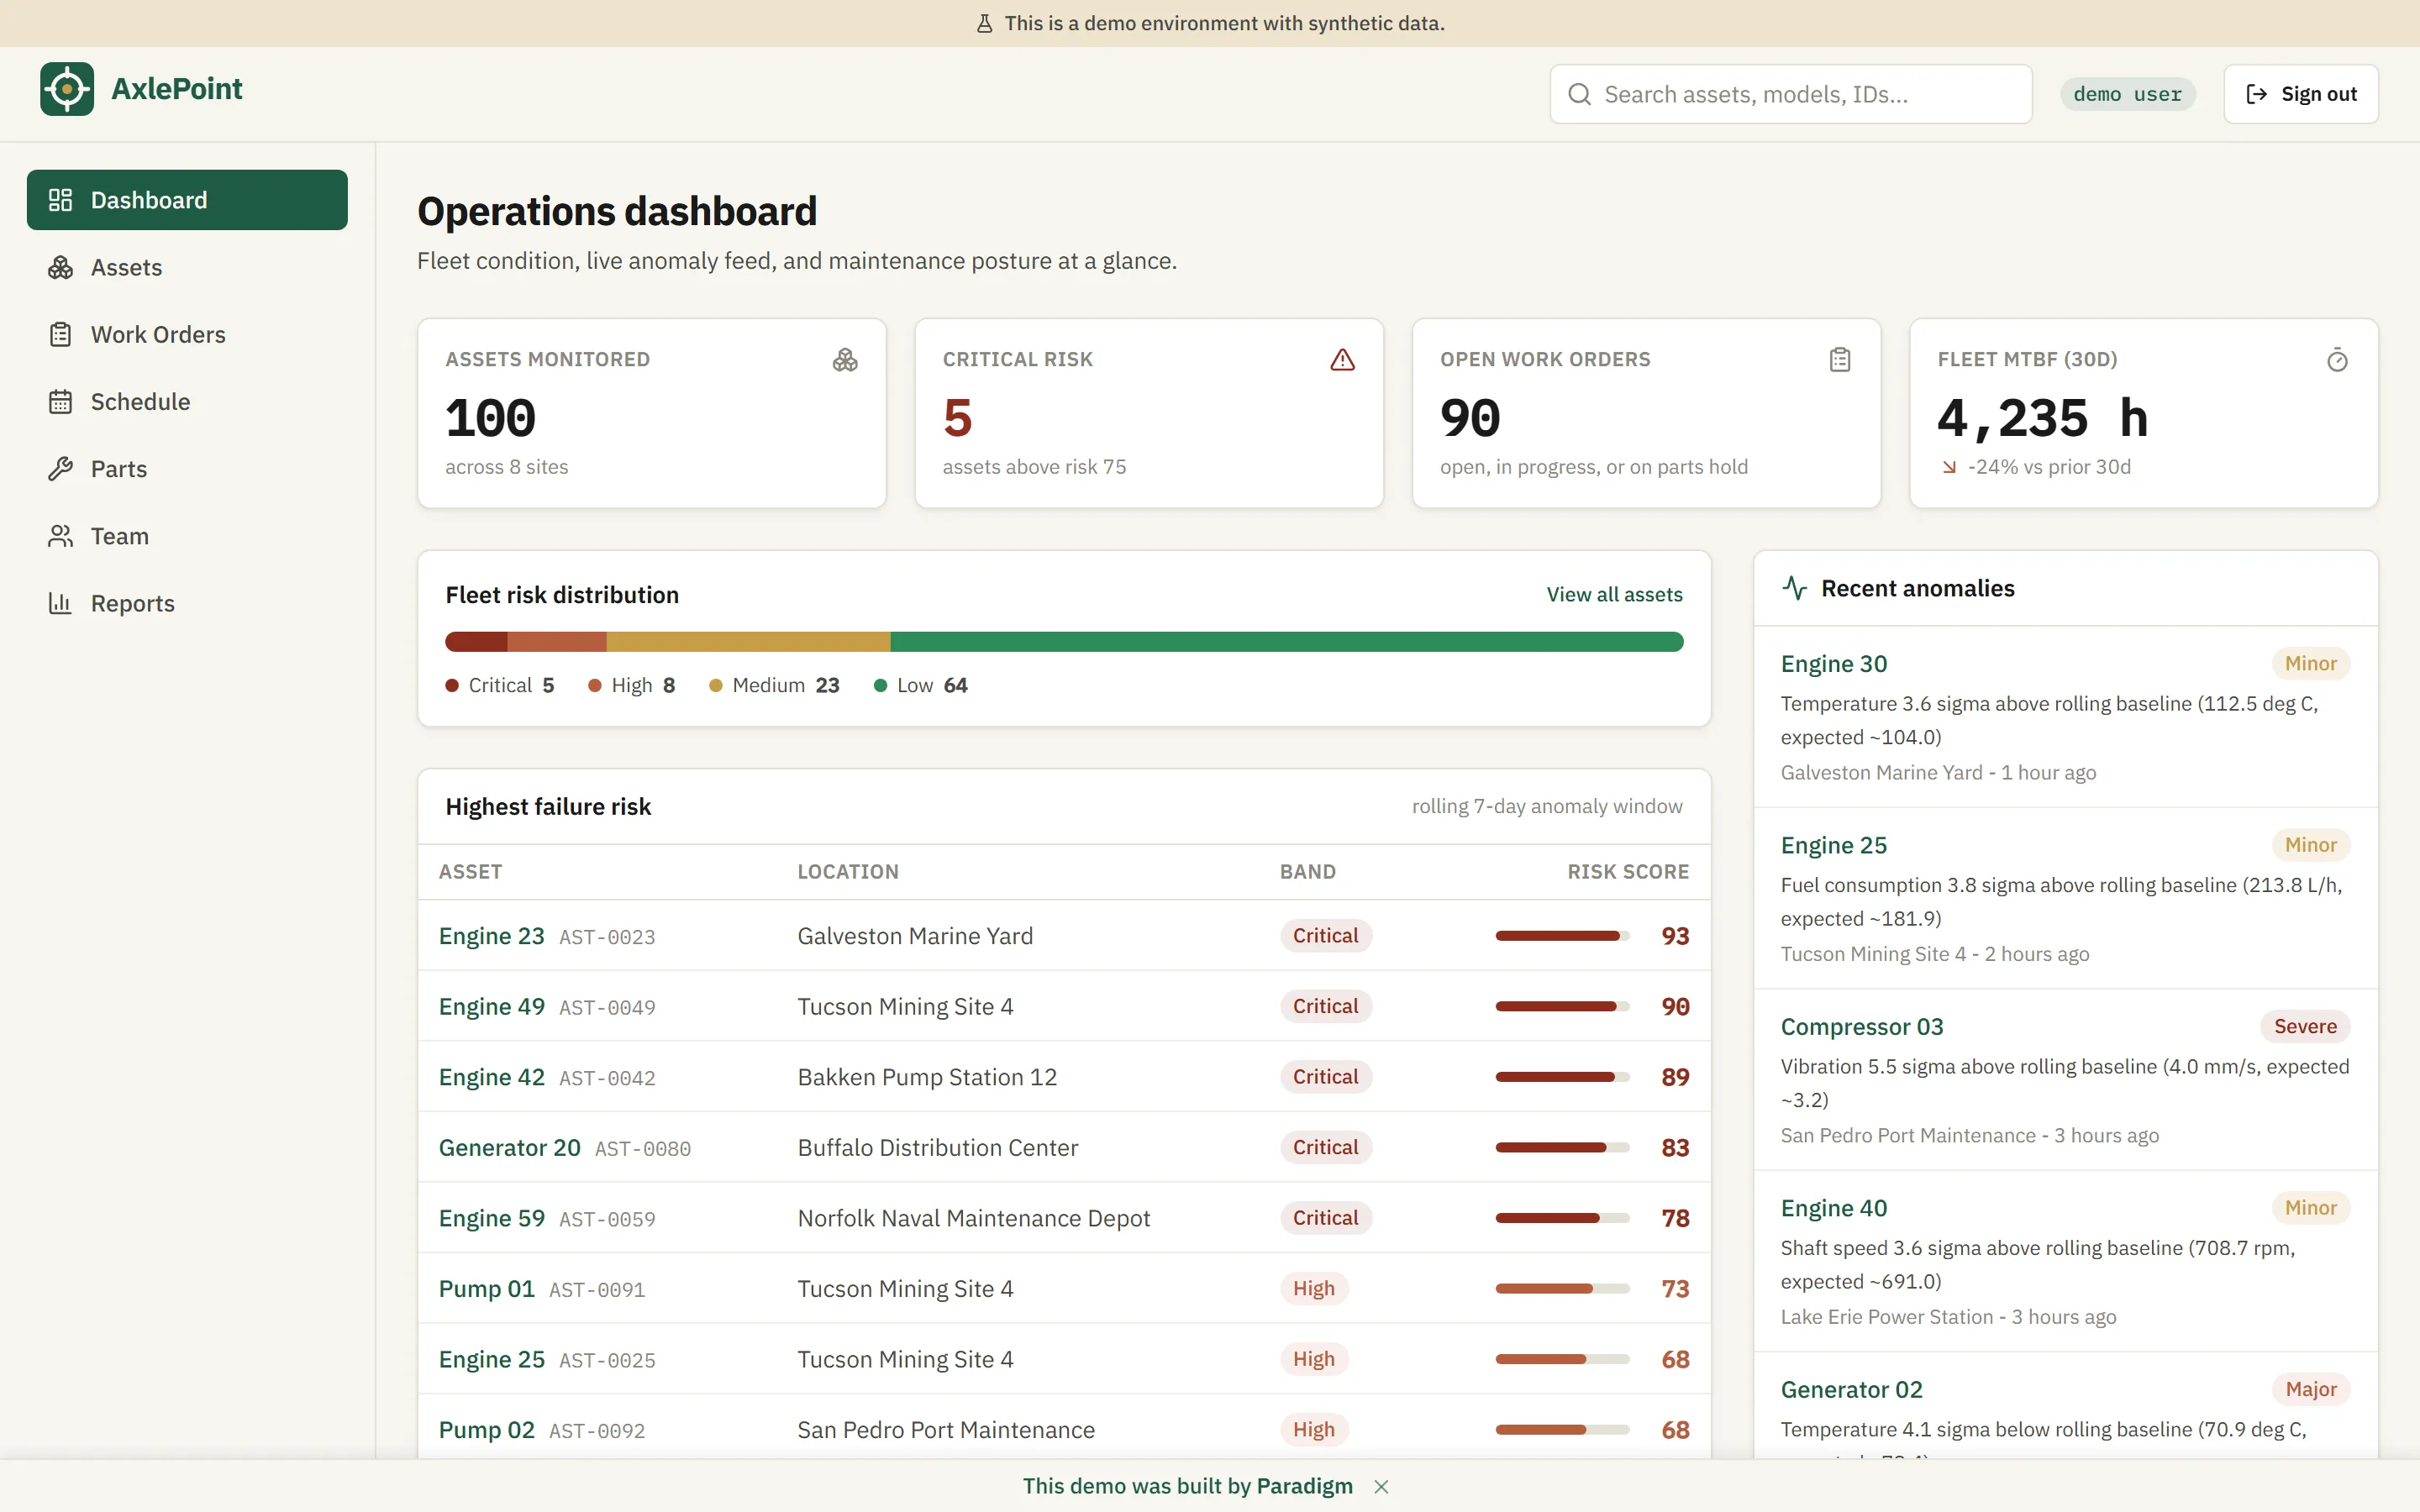
A complete maintenance operations platform over a synthetic fleet: 100 assets across eight sites, six months of hourly sensor telemetry (vibration, temperature, oil pressure, cylinder pressure, shaft speed, fuel consumption), 150 work orders in every lifecycle state, a preventive maintenance calendar, parts inventory with reorder tracking and supplier lead times, and a technician roster. Next.js 14, TypeScript, SQLite, all served from a single container behind Cloudflare.
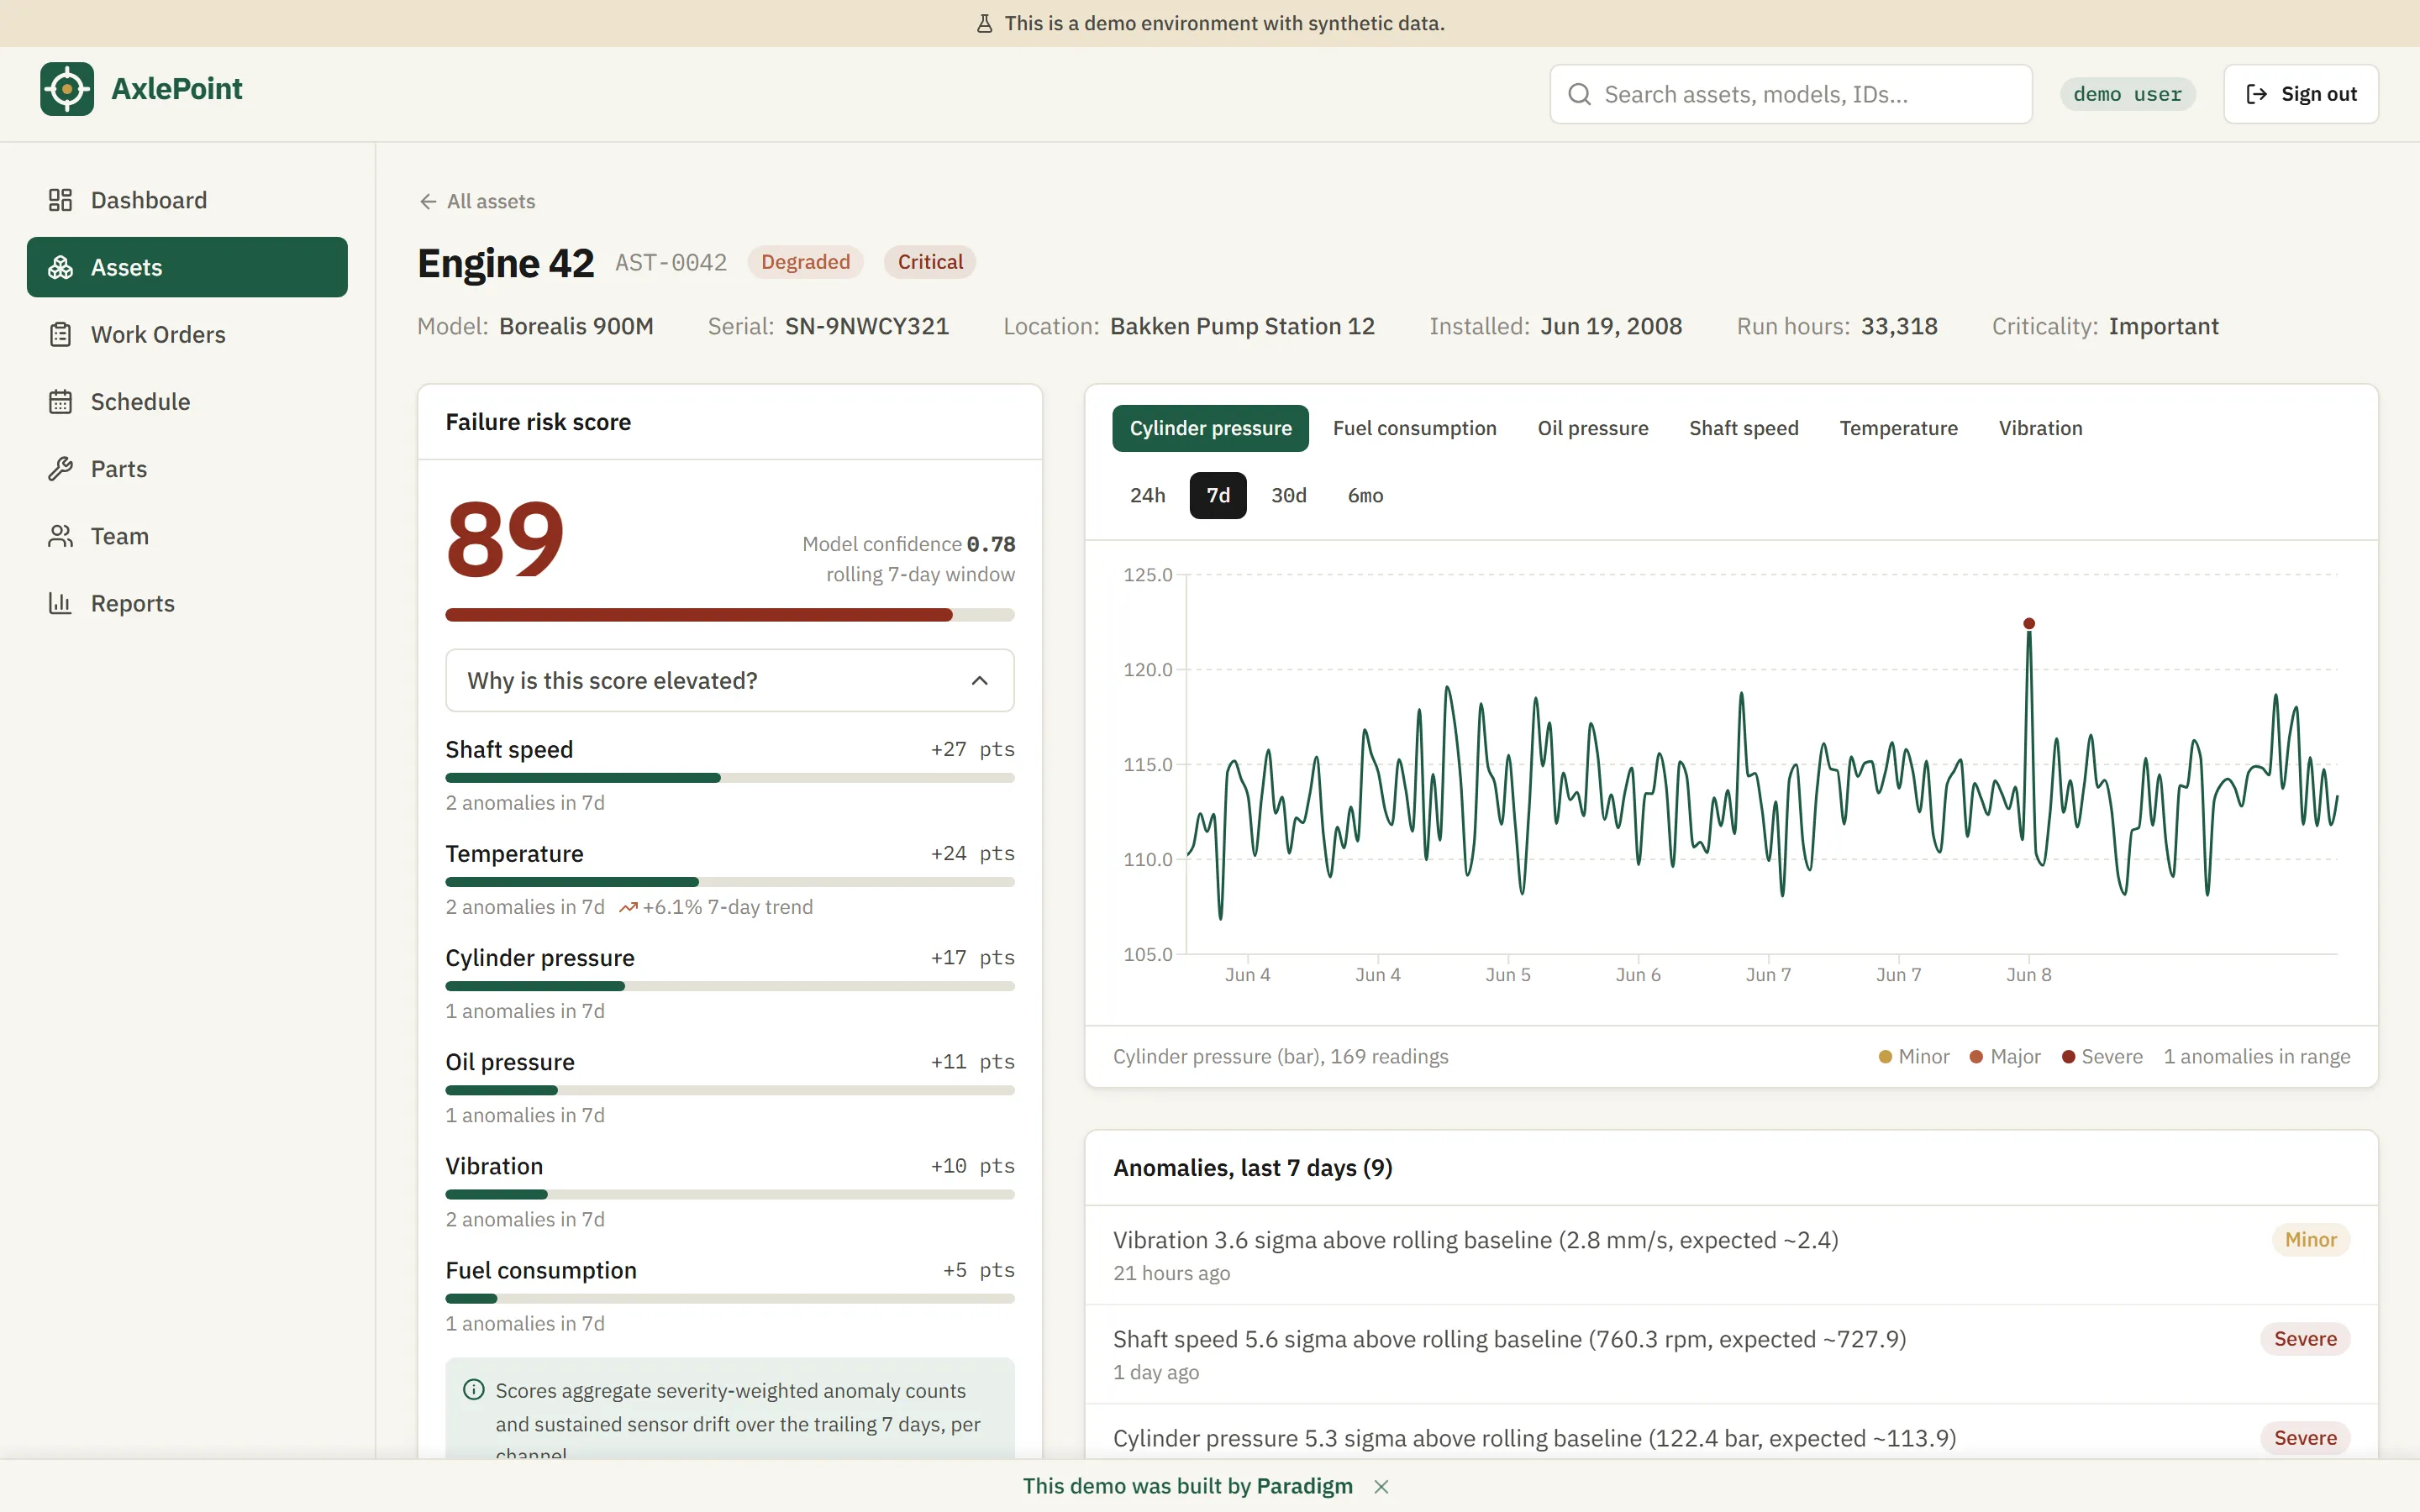
The headline layer is predictive: a rolling anomaly detector (exponentially weighted mean and variance per sensor channel, z-score thresholding) feeds a 0-100 failure risk score per asset. The score is explainable by construction. Open any asset and the panel shows which sensor channels are driving the number, how many anomalies each produced in the trailing window, and how far the channel has drifted in seven days.
From anomaly to work order
Detection without action is a dashboard, not a tool. On any elevated asset, one click drafts a predictive work order pre-populated from the anomaly pattern: a vibration trend drafts a bearing and alignment inspection, a falling oil pressure trend drafts a lube system inspection with an oil sample. The draft lands in the same work order queue the rest of the operation runs on, ready to assign and schedule.
The production path
The demo's detector is deliberately a transparent statistical model. In a production engagement the swap is a trained sequence model over historical failure data, behind the same scoring interface, with the same explanation panel and the same one-click path from signal to scheduled work. Data discipline first, then the model. The UX a maintenance team learns on day one does not change when the model underneath gets smarter.
Want this shape of system over your fleet's real telemetry? Tell us what you're trying to do.